WHAT HAS BOA'S PERFORMANCE FIT LAB ACHIEVED IN 2021?
By  Dan Feeney
  Kate harrison
Follow on ![]() @Dfeeney31 and @running_geek
@Dfeeney31 and @running_geek


Dan’s Take
The first 6-months of 2021 have been a whirlwind where we safely opened testing up to a wider group of athletes in our lab and on the mountain. We gained new insights into testing snowboard, workwear, and hiking boots, while we continued testing of trail running and court-based shoes. Starting this year, we are building a large-scale database to link performance data from each time an athlete lands on the ground, initiates a turn, or performs a cutting motion with subject foot shapes, shoe configurations, and more.

Kate's Take
In 2020, we established that yes, fit does matter to performance. Since then, 2021 has been about building on that foundation. We have had the opportunity to get several new projects off the ground, aiming to understand what different needs athletes have in the mountains vs on the roads, or on foot vs on two wheels. We are also starting to identify the underlying principles that define good fit across all sports. Here are some of our insights so far this year.

Boa’s Take
The Performance Fit Lab at BOA is uniquely positioned to uncover insights into how different attributes of a product impacts athlete performance. By testing such a wide variety of products across different segments, with varying constructions, and with so many high-level athletes, we can isolate variables that most labs only dream of studying! Moreover, we are pioneering the research of new ways to quantify fit and publishing our results to get feedback from other scientists. Below, you will find a brief summary of what we have discovered, hypothesized, and tried in several segments.

Endurance & Health - Running
Over the first 6 months of 2021, we analyzed data from 16 runners across multiple tests with a variety of shoes from 5 different brand partners, which included 4785 steps analyzed on the treadmill and 3457 steps on the trail.
In the lab and on the trails
Not surprisingly, the forces encountered by runners differ substantially on the trail versus in the lab. In the plots below, the force measured under the foot of a single runner is averaged and plotted on the Y axis with 0 representing when their foot touches the ground and around 0.25 seconds later when they push off the ground. The plot shows the average force when the athlete was running uphill (top plot), downhill (middle plot), and on a treadmill with no incline (bottom plot) at the same effort (speed varied on the trail due to changes in slope and surface). This plot also shows the average (dark lines) and standard deviation (shading) from a single runner at two stages on our BOA trail loop (top and middle panel) and on the treadmill (bottom panel).
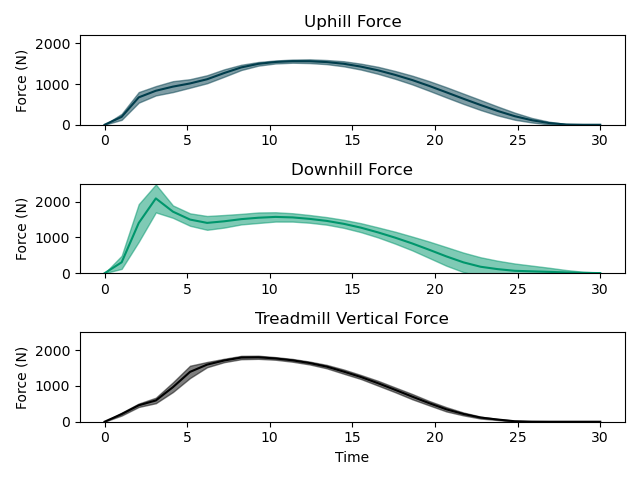
A primary takeaway from this data is that downhill landings challenge the fit of shoes more than flat or modest climbs. The large initial peak in force during downhill running exacerbates any differences in the shape of the shoe compared to the foot. Our data suggests that a better fitting shoe can reduce forward or lateral sliding of the foot within the shoe.
On the other hand, steep uphill segments can be a fantastic challenge for heel hold since runners are often on their toes, creating a lever that can lift the heel out of the heel pocket. Locking the heel in through the instep hold that is angled to draw the heel into the heel cup substantially improves fit. Both the La Sportiva Cyklon and VK BOA are both prime examples of trail running shoes that were specifically designed to address this need. And the differences are tangible when compared to similar footwear options on the market.
A key metric that is consistently associated with fit based on data in our lab and others is the vertical loading rate (or how quickly force gets loaded onto a runner). Vertical loading rate increases with increased speed and is substantially greater during downhill trail running compared with uphill. Shoes that fit better decrease loading rate, likely because if we can hold the foot more securely to the midsole, runners can take full advantage of the cushioning properties of the shoe. This difference is largest on steep downhills.
Quantifying Heel Hold in Running
Another critical metric of fit is heel hold. In our testing, we have seen reductions in the variation in heel pressure during running, which is a key performance indicator in trail shoes. We are presenting this newly-developed metric at the Footwear Biomechanics Symposium this summer to get feedback from other leading researchers. We will share the results of this conversation with you following the symposium.
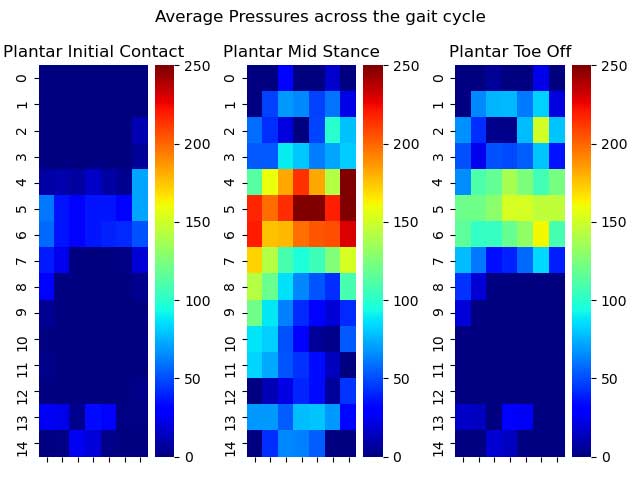
This figure shows the average pressures across 99 locations along the bottom of the foot at initial contact (left), mid stance (middle), and near the end of stance (top of the images are the toes, bottom of the images is the heel). We quantify how much the pressure under the heel varies from mid-stance to toe-off as a measure of heel hold that has been consistent with qualitative feedback.
Additional findings
- Our 4-guide overlapping panels configuration has resulted in the lowest vertical loading rate when controlling for speed on both the trails and treadmill.
- On average, shoes with lower heel-toe drops are also associated with lower vertical loading rates, however the optimal heel-toe drop for a runner depends on their injury history and goal race distance.
- Highly resilient foams that comprise the midsoles of super shoes pose an interesting challenge to heel hold due to the teeter-totter effect and more compliant foams resulting in more dynamic foot movement within the shoe during gait.

Agility & Speed: Tennis, Badminton, Basketball, and More
Agility has been one of our most tested attributes, with 1203 changes of direction recorded across 21 different athletes, from basketball and tennis players to trail runners. One of our key metrics in agility is the time to change direction normalized to how much force the athlete produces. This metric requires the ability to both quickly stop, as well as to rapidly accelerate in the opposite direction. The time to change direction is dependent on which plane an athlete is moving in – each movement challenges shoe fit in a different direction, which means certain configurations can be best suited to different sports and playing styles. However, the ideal shoe can offer athletes the support and flexibility to move confidently in all directions.
- The highest jump recorded in the past 6-months was 47 cm (about 18 inches) – which occurred during 8 rapid countermovement jumps.
- Countermovement jumps took 2% longer to change direction than skater jumps
- The configuration that produced the fastest time to change direction in both skater jumps and countermovement jumps was our 4-guide overlapping panels configuration.
- Below, you can see data from a single subject during our latest test of a 4-guide overlapping panels configuration during skater jumps. A skater jump is where an athlete facing forward jumps sideways, landing on their dominant foot, changes direction quickly by producing a shear (lateral force) and jumps back onto their non-dominant foot. Think Apollo Ohno on the short track during Olympic speed skating. The data below is the force under the dominant foot.
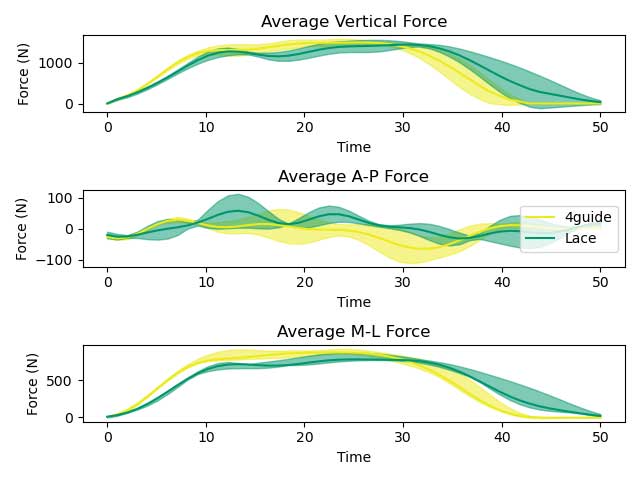
- The ground reaction forces are yellow for the 4-guide overlapping panels and green for the baseline lace model. Just like the running figure, 0 on the X-axis represents when the athlete landed on the force plate and when the colored line returns to 0 N of force (near 0.4 or 0.5 s) is when they took off again. The force is a vector and is broken down into its three orthogonal components (vertical, anterior-posterior, and medial-lateral). For skater jumps, athletes want to produce as much lateral force (bottom plot) as quickly as possible, which is depicted by a greater peak and faster return to 0 in the 4 guide (yellow) configuration.
This figure shows average vertical, anterior-posterior, and medial-lateral forces from a single subject doing 8 skater jumps in each configuration (a 4-guide set vs. a laced configuration). Similar to our validation study, we see a faster time to change direction with a greater rate of force development during the propulsive phase of the movement.
- As we continue to collect larger amounts of data, we are exploring the relation between how far the athletes center of pressure moves during a change of direction with performance. Our hypothesis is that athletes need some movement (otherwise they would be in a cast), but too much movement will be wasted and decrease performance. This will help us innovate new solutions with our brand partners.

Snowsports: Our Heritage
The biomechanics of snow sports have been historically difficult to study – it’s hard to recreate mountains and consistent snow conditions within the four walls of a lab! We’ve brought the lab outdoors, using force insoles and body-worn inertial sensors to quantify snowboard performance in difference BOA configurations. During our preliminary investigation in March, we assessed 4 snowboarders, for a total of 220 turns analyzed (110 heel/110 toe). While our tests so far are not comprehensive, in number of testers or turns, this initial investigation supports our longstanding belief that power transfer is a key metric that can be influenced by a rider’s boots.
- Toe turns- on average- had peak forces 29% greater than heel turns.
- Goofy riders produced 15% greater peak forces on their rear foot meanwhile regular riders were more symmetrical. This should be taken lightly as we have only analyzed data from 4 snowboarders to date.
Snowboarders were able to produce greater peak forces and a faster time from turn initiation to peak force in a dual dial BOA configuration relative to a laced model.
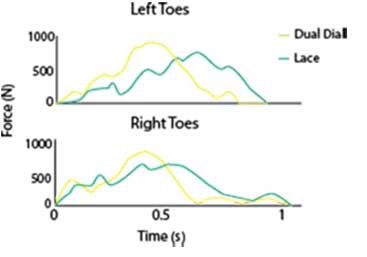
An example time series from a single toe turn from one of our snowboard testers in a dual dial configuration and a laced boot. You can observe greater peak forces and a shorter time to get to peak force in the BOA (yellow) configuration relative to the lace (green). These are key metrics where our lab is pioneering the understanding. We will be presenting this data at The Footwear Biomechanics Symposium this summer in addition to the other data points around running, outlined above.

Golf
While we would love to help every golfer hit 300+ yard drives, we find shoes have only a small effect on yardage. However, our testing shows that better fitting shoes can help a golfer to be more consistent in their drive distance and direction – which translates into more shots on the fairway and less time in the rough.
- Similarly to running, a greater peak toe pressure during a golf swing is associated with worse fit as the golfer must claw their toes to push forward during the down swing. Our overlapping panels configuration has appeared on market in the Adidas ZG21 BOA and the FootJoy Hyperflex BOA. Both configurations were tested in our lab using these pressure metrics, in addition to a Trackman Launch Monitor, to evaluate how they improve golfer power and precision.
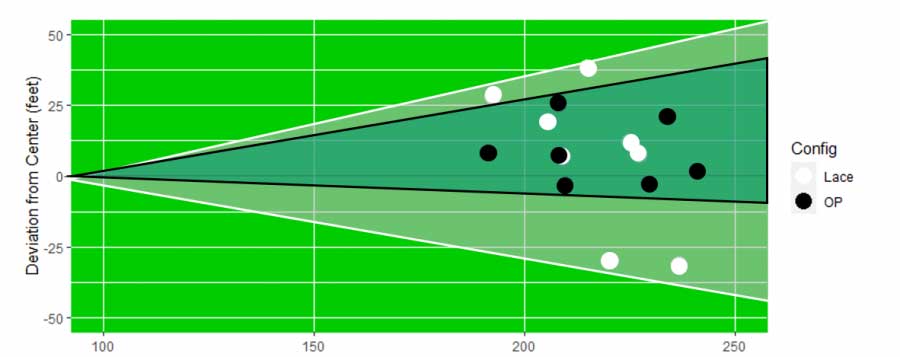
- In our performance tests, golfers shot straighter and achieved more consistent drive distances in our overlapping panels configuration (black dots) vs. Laces (white dots). This testing helped inform the design and development of these shoes.
Concluding remarks
We hope this deep dive into some of our data was interesting and thought provoking. While we are not basing any claims of this data alone (the sample sizes are too small), we strongly believe in sharing data to improve the science of fit and performance. We are looking forward to sharing these summaries of our testing with you on a regular basis and would love your feedback and questions!
We can be found on twitter @Dfeeney31 and @running_geek